
Most small-business CEOs concentrate on familiar figures when they meet the marketing department, such as the number of sales leads or average order value. But an annual check on other metrics can reveal marketing weakness.
Here are some figures that many B2B marketing executives would prefer not to discuss, yet they identify areas for improvement and can sometimes be easily fixed.
#1 – Social media website traffic
On average, just 6.44% of website traffic comes from social media platforms (I’ve seen figures as low as 1% or 2%). That’s bad when you consider the resources (time/money) organisations devote to this channel.

So get the username & password for your Google Analytics account and check the figures. You may be surprised.
Click the Acquisition tab of the left-hand menu in Google Analytics, then select ‘All Traffic’ and finally ‘Channels’ to do your marketing check.
Don’t just look at the percentage of traffic from social, also examine the Bounce Rate (more on that later).
Why is it important to drive traffic from social to your website? Because there is less competition/distraction on your site, visitors can focus on your proposition and you can fully explain it with rich media. You also have room to deal with objections and can lead visitors along a path to a call-to-action with a form to complete.
Here is how you fix low traffic from social media.
#2 – Website bounce rate
What is ‘bounce rate’? Bounce is a measure of poor website traffic. Google Analytics defines bounce as a visitor viewing a single page with no interaction and a duration of 0 seconds.

So an 80% bounce rate means that 80% of the visitors to your website were not interested and left very, very quickly.
Take another look at your Google Analytics dashboard and see the bounce rate for your whole site, but also examine the bounce for Social Media and Google Ads (Display and Paid Search). Their bounce can be very high, so they are driving poor quality traffic to your site.
Click the Acquisition tab of the left-hand menu in Google Analytics, then select ‘All Traffic’ and finally ‘Channels’.
Notice that while the bounce rate for ‘Paid Search’, ‘Display’ and ‘Social’ may be high, it’s likely ‘Organic Search’ has a low rate. Visitors that reach your site after finding you organically on a search engine tend to be better quality traffic.
Here is how you fix a high bounce rate on your website.
#3 – Google Ad click rate
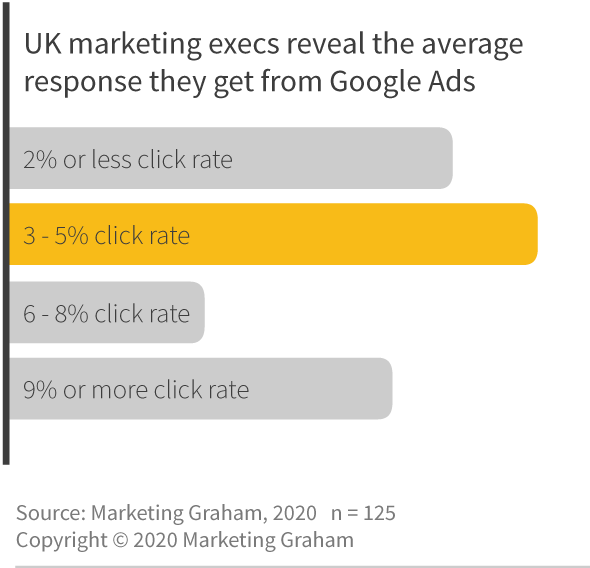
There’s a lot of secrecy about advertising performance – nobody wants to admit they may be getting a poor response.
I decided to do some anonymous research to discover the average response to Google Ads. The result is a majority get a 5% click rate or lower (but my experience is 1-2% on average).
So on average, 95% of your Google Ad budget is wasted?
Google Ads can play a role. For example, getting a good ranking organically on a search engine can take time (3-6 months?). Google Ads are a shortcut to a high ranking, useful if you want to test new search terms or a new product/sector.
Be clear about your objective before diving into Google Ads and be aware that short-term campaigns are fine.
Here is how to improve ROI on Google Ads.
#4 – Email opens and clicks
For some time the open/click rate on email campaigns was falling, but the last few years have seen an improvement. Better email marketing? Unfortunately, no.
More and more organisations are employing security bots to open and check the links in emails before they are delivered to the recipient. These automated opens/clicks are counted as valid by your email marketing platform – it’s a false positive.
They are relatively easy to spot. If an email is opened and clicked within milli-seconds of it being sent it’s probably a security bot. No human can do it that quickly.
Why is this important? Because your sales team have probably been told to follow-up any opens or clicks from email campaigns – but they may be calling people that have never opened/clicked and will enter into awkward ‘cold’ conversations.
Here is how you fix false positives on email campaigns.
#5 – B2B prospect data

I’d be a rich man if I had £1 for every time a CEO has told me their data is great, and I’ve proved them wrong.
Truth is, nobody forensically checks the quality of their prospect data.
Data checking can be boring. All too often it falls between two stools – the marketing team think the IT/Data department is doing it, and the IT guys think marketing is on the case.
Yet sales teams demand (rightly) that they need good data to identify and contact the best prospects – and CEOs are quick to recognise its value when a member of staff is accused of trying to steal it.
The figures opposite show the quality of some prospect data I recently encountered during a marketing check.
Without an email address I can’t include a prospect in an email campaign, without their full name I cannot personalise and the sales team will not find them on LinkedIn, and without a job title, we cannot make the message relevant. Poor data = poor marketing.
Here is how you improve the quality of your data.
Conclusion
I’m on a crusade to make smart decisions based on objective facts and critically examine areas where my marketing can improve. It means I conduct a marketing check and admit where I’ve made errors. But that’s how we learn, right?
My first two commitments are 1) not to believe the hype surrounding B2B social media, and 2) improve my Google Ads click rate. What do you want to improve? Drop me an email.
Get my blog posts, reports and videos delivered straight to your Inbox, just 8 times a year. It’s free but not cheap. Complete the form below to receive the Marketing Graham Bulletin; you can unsubscribe at any time.
| Marketing Graham Bulletin |
|---|