I’ve been using Google Analytics (GA) for more years than I care to mention, and here are five things that I believe could make a difference to your marketing intelligence.
GA changed its user interface in 2017 – some people like it, some people don’t. I think it’s an improvement. To get the most out of it I recommend the following…
Tip 1: Exclude staff IP addresses
Your own staff will access your website on a regular or semi-regular basis. Their visits can distort your figures, giving you false information about which pages are popular.
You can exclude their visits by adding their IP addresses to a filter.
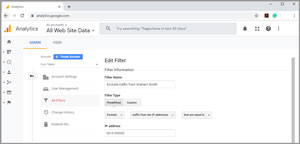
Simple steps: Go to the Admin section (cog icon in the bottom left corner) and click All Filters.
Click the Add Filter button and complete all the information. Take a look at my screenshot to see an example.
Tip 2: Set Goals
To judge whether your website is adding value to your marketing you will need to set goals for it to achieve.
Google Analytics enables you to set up to 20 goals for you to target. I recommend that you also assign a monetary value to each goal.
Beyond the obvious ‘how much have they spent’, you can also calculate the value of your visitors completing a form. For example, you may know that if someone completes a form to download a free report there is a one-in-three chance they will become a customer.
If the average customer spends £900 p.a., then each completed form is worth £300.
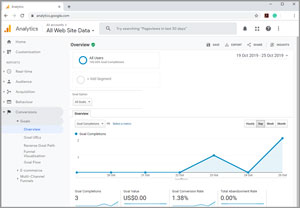
Simple steps: Go to the Admin section (cog icon in the bottom left corner) and click Goals in the far right column. Click the New Goal button and make your selection. Take a look at my screenshot to see an example.
Tip 3: Visitor intelligence
The more you understand about your visitors the easier it is to target more of them or make changes to attract a different audience.
Google offers you two insights; Demographics and Interests. Go to the Audience tab and then click either Demographics or Interests.
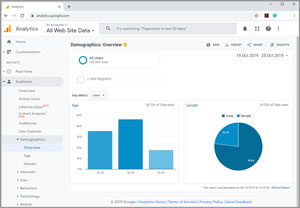
The demographics view shows you the age and gender of your site visitors. Sometimes it’s revealing to compare this to the national average. In the UK, there are 52,410,000 adults (over 18 years old); 49% are male and 51% are female*. The age breakdown is as follows:
- 18-24 year olds – 5,713,000 (10.9%)
- 25-34 year olds – 8,990,000 (17.2%)
- 35-44 year olds – 8,365,000 (16.0%)
- 45-55 year olds – 9,181,000 (17.5%)
- 55-64 year olds – 7,996,000 (15.2%)
- 65+ year olds – 12,165,000 (23.2%)
See how your site compares and make some judgements. Take a look at my screenshot to see an example.
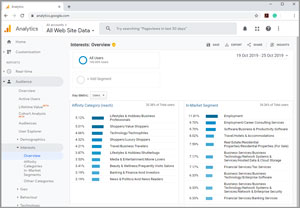
The interests view shows you the subjects your visitors have engaged with in the past.
There are 3 breakdowns for you to view; Affinity Category, In-Market Segment and Other Category.
The Affinity Category and Other Category are the least valuable in my opinion. They show the interests of visitors that are at an early stage in the sales funnel.
However, the In-Market Segment shows visitors likely to be ready to purchase your product or service. They are visitors near the end of the sales process.
Occasionally this view will show you subjects of interest to your target audience that you may not have considered. It can be helpful in building a better audience profile and identifying new avenues for approaching them. Take a look at my screenshot to see an example.
Tip 4: Remarketing
As traffic to your website builds, Google Analytics will send you a message that you are eligible for Remarketing. This is great news.
Remarketing involves targeting visitors who have viewed something on your website or demonstrated an interest in your product/service. It offers a way to re-engage with them if they didn’t take action.
Failing to take action does not mean they failed to purchase. It could mean they didn’t leave their email address or subscribe to your list, follow you on social media, complete a survey, etc.
To qualify for Remarketing your audience must include a minimum of 100 unique visitors (or cookies) for the Google Display Network to serve your adverts. To display your adverts on the Google search results you will need a minimum of 1,000 unique visitors (cookies).
You will need to add a tag to the code of your website to capture the ID of your visitors. This can then be linked to your Google Ads account so you can start targeting them with online advertising.
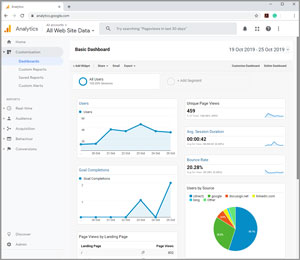
Tip 5: Dashboard
Google Analytics provides a wealth of statistics and numbers. And that can be a problem. You get swamped and confused.
Fortunately, Google provides a way for you to customise your view of the figures.
Take a look at my screenshot to see an example.
You can add whatever metrics you like to the customised dashboard. My preference is to view the number of users, unique page views, time spent on the site (session duration) and bounce rate (when a visitor views a single page for 0 seconds).
I also like to see how we are performing against the Goals we have set as well as the most popular landing pages.
These are figures which I can easily digest and report to my C-level colleagues.
Bonus Tip – take action
Having all this intelligence is great, but not if you fail to take action. Make a point of discussing the stats with colleagues and form a plan to improve some of the figures – especially the Goals.
That’s my top tips for Google Analytics, if you have any more please add them to the comments box below 🙂
* Source: Office for National Statistics (ONS), Population Estimates for UK, England and Wales, Scotland and Northern Ireland – Mid-2018Get my latest blog posts, reports and videos delivered straight to your Inbox, just 8 times a year. It’s free but not cheap. Complete the form below to receive the Marketing Graham Bulletin; you can unsubscribe at any time.
| Marketing Graham Bulletin |
|---|

